Text: Oliver Wurl, Photos: Leonie Jaeger, Pia Göcke
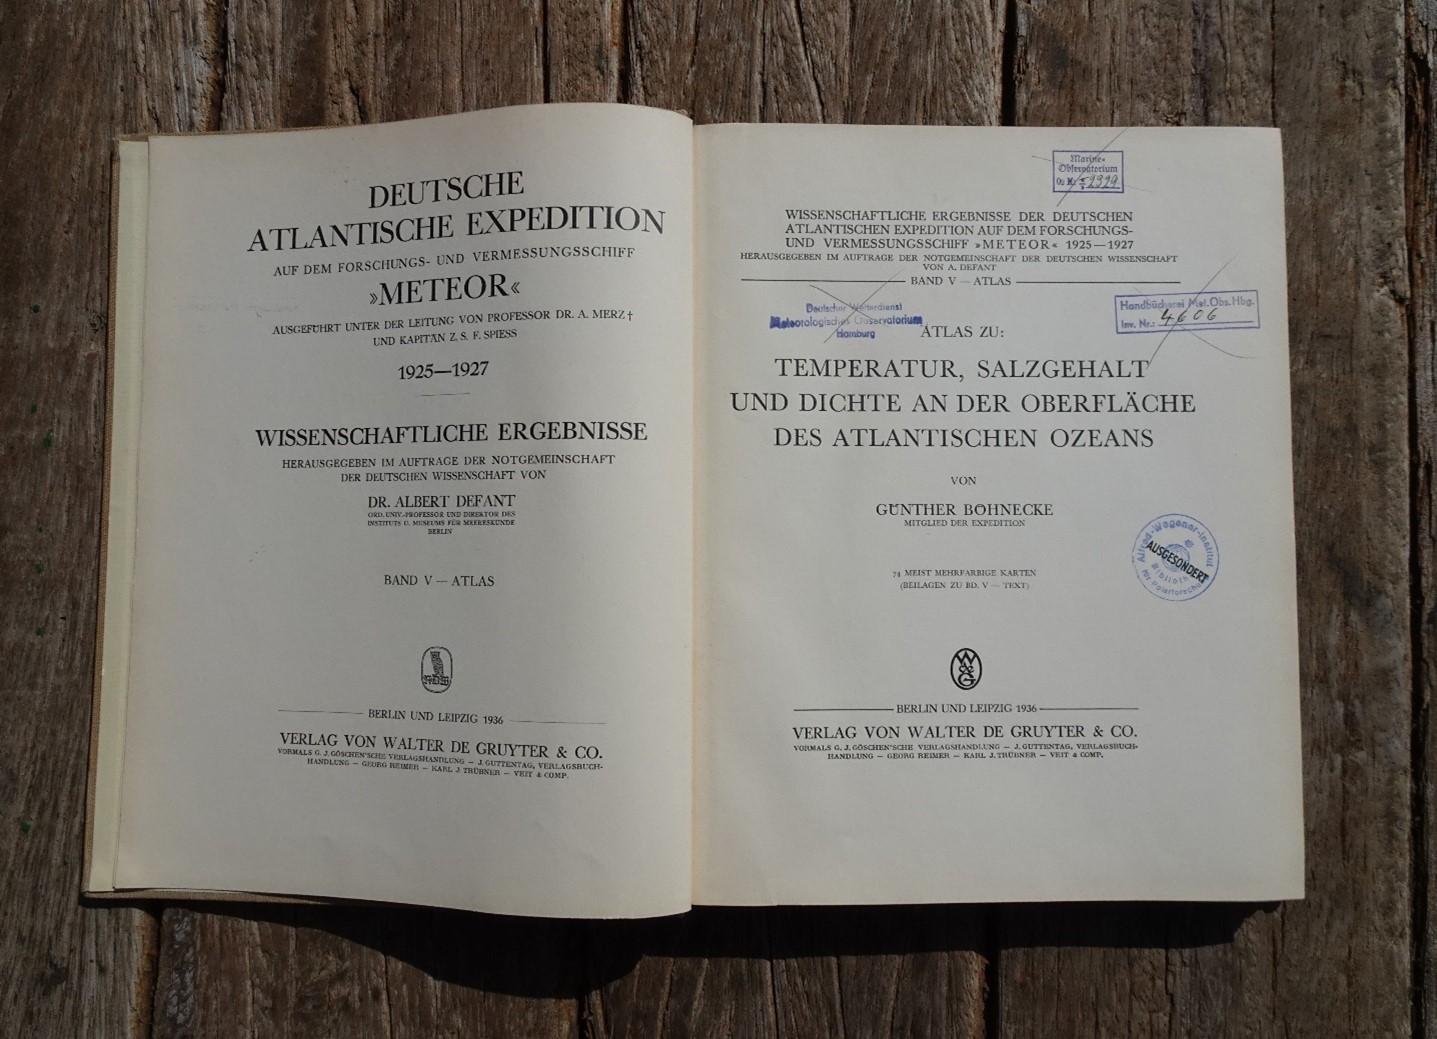
Das Ziel unserer Expedition mit der METEOR III ist es, Verdunstungsprozesse über den Ozeanen besser zu verstehen und somit zu einem besseren Verständnis des globalen Wasserkreislaufs beizutragen. Dabei gibt es einige Parallelen zur damaligen deutschen Atlantischen Expedition auf der Meteor I, auch wenn die Ziele der beiden Expeditionen unterschiedlich sind. Die METEOR I lief am 16. April 1925 in Wilhelmshaven aus und kehrte am 2. Juni 1927 dorthin zurück. Nicht nur haben beide Schiffe den gleichen Namen, sondern die beiden Expeditionen liegen auch genau 100 Jahre auseinander. Außerdem arbeiten einige unserer Fahrtenteilnehmer am ICBM in Wilhelmshaven. Die größte Parallele liegt jedoch in den Messungen: Während unserer Expedition stehen Messungen der Temperatur und des Salzgehalts im Atlantik im Vordergrund, um Rückschlüsse auf Verdunstungsprozesse zu ziehen. Auch vor 100 Jahren führten Wissenschaftler Messungen von Temperatur und Salzgehalt durch, um die Zirkulation des Atlantiks zu verstehen (Bild 1). Insbesondere die Frage, ob ein Wasseraustausch zwischen dem Südatlantik und dem Nordatlantik über den Äquator existiert, beschäftigte die Wissenschaftler an Bord der Meteor I. Dazu wurden auch meteorologische Daten erfasst – wie auch auf unserer Expedition.
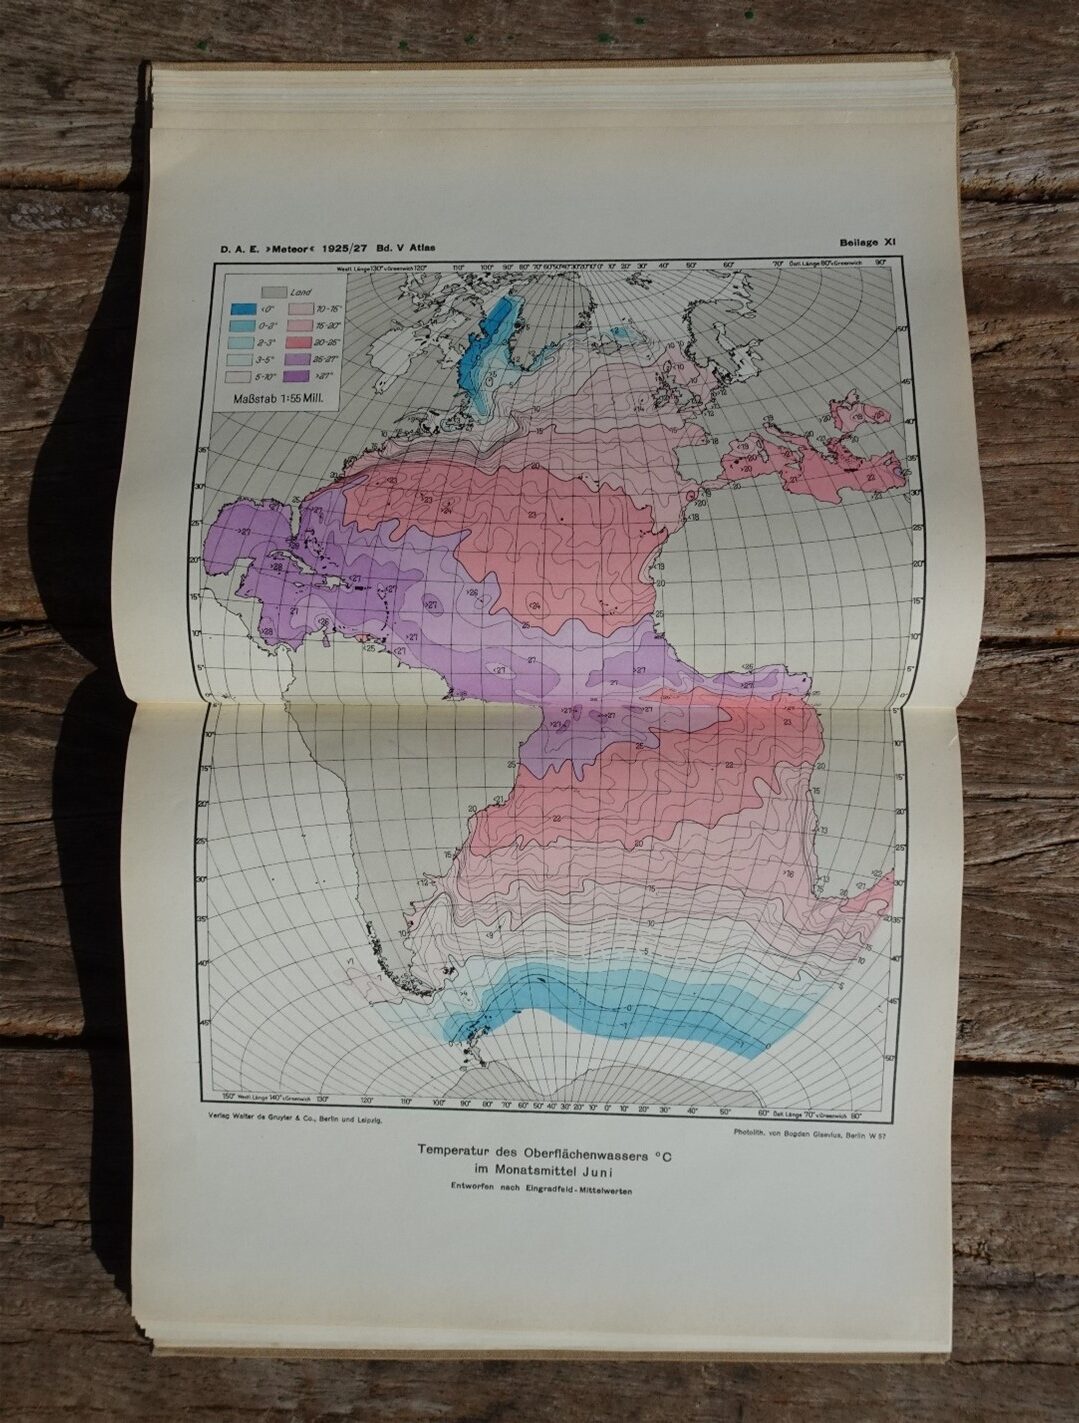
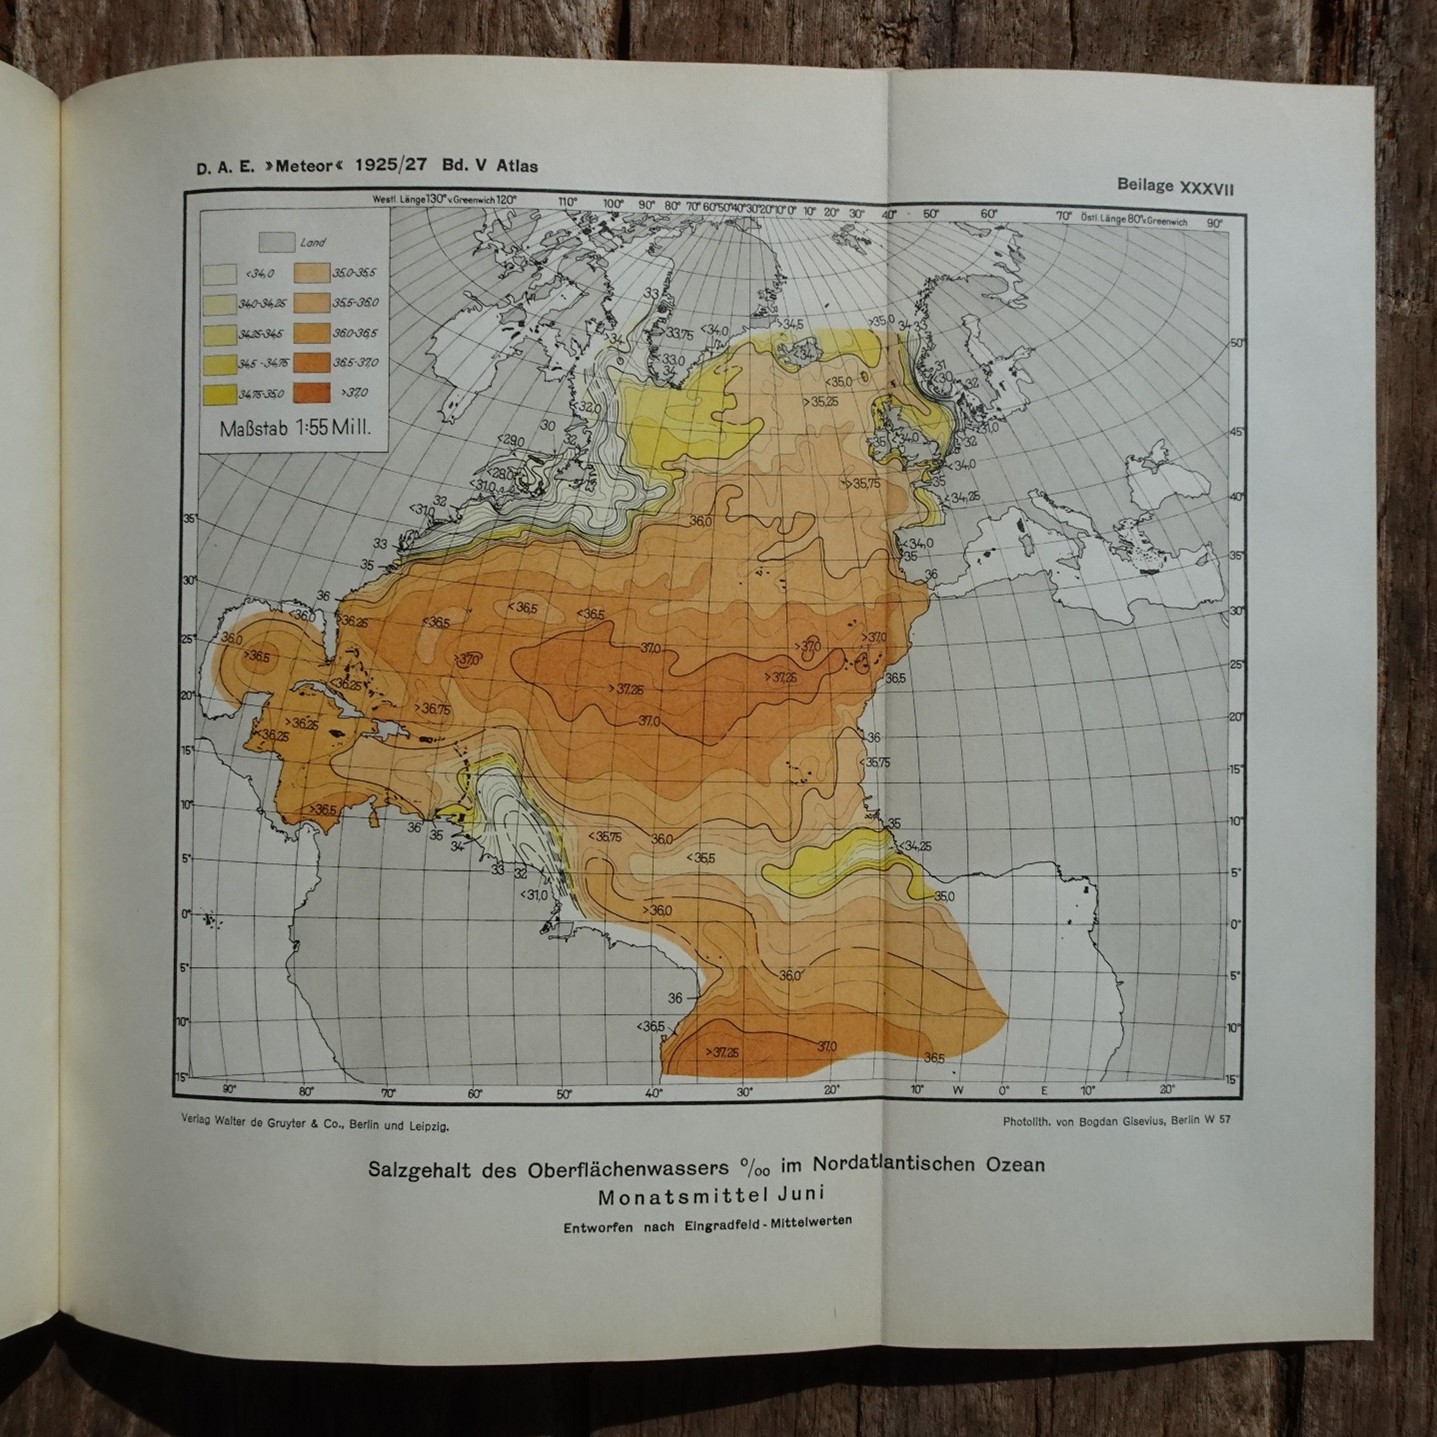
Die Ziele und die Bedeutung der beiden Expeditionen waren unterschiedlich: Die Expedition von 1925 bis 1927 gilt in der Ozeanografie als Meilenstein und als Geburtsstunde der physikalischen Meereskunde. Seitdem begleitet sie die theoretische Ozeanografie. In 100 Jahren verändert sich viel (vielleicht zu viel?), auch in der Ozeanografie. Heute haben wir hochgenaue Sensoren zur Messung von Temperatur und Salzgehalt, die es uns erlauben, lückenlose Messungen bis zu mehreren tausend Metern Tiefe durchzuführen. Für diese Tiefenprofile werden je nach Tiefe in der Regel zwei bis drei Stunden Zeit benötigt. Während die METEOR III fährt, wird auch kontinuierlich Wasser durch einen sogenannten Thermosalinograph gepumpt, um oberflächennahe Daten aufzunehmen. Vor 100 Jahren wurden Temperatur und Salzgehalt in unterschiedlichen Tiefen ganz anders vermessen, um Karten über deren Verteilung zu erstellen (Bild 2). Dazu wurde ein Kippthermometer zusammen mit einem Wasserschöpfer an einem Draht befestigt und zu einer bestimmten Tiefe abgesenkt. Dann wurde ein Fallgewicht auf dem Draht losgeschickt, um an dieser Tiefe den Mechanismus zum Schließen des Wasserschöpfers und das Kippen des Thermometers auszulösen. Durch das Kippen wurde eine bestimmte Menge Quecksilber in einer Kapillare abgetrennt und anhand dieser Menge konnte die Temperatur an Bord bestimmt werden.
Der Salzgehalt wurde aus der Wasserprobe des Schöpfers ermittelt. Dazu wurde eine bestimmte Probenmenge mit Silberionen titriert, um die Gesamtkonzentration der Chlorid-(Cl⁻), Bromid-(Br⁻) und Iodid-(I⁻) Ionen zu bestimmen. Da die prozentuale Zusammensetzung der Salzionen im Meerwasser konstant ist, konnte man die Gesamtkonzentration aller Salzionen ausrechnen. Dieser wurde als Salzgehalt in Gramm pro Kilogramm Meerwasser oder Promille angegeben. Diese Methode hat sehr viel Zeit in Anspruch genommen.
Obwohl die Messmethoden und Ziele der Expeditionen unterschiedlich waren, lassen sich einige Parallelen nicht leugnen. Die Erstellung der Karten zur Verteilung von Temperatur und Salzgehalt im gesamten Atlantik bedeutete zwei Jahre Arbeit. Ohne diese Daten hätte man vermutlich erst viel später etwas über die Zirkulation des Atlantiks und somit über ihre Rolle im Klimasystem erfahren. Die Expedition M211 ist unterwegs, um hierzu ebenfalls einen Beitrag zu leisten.
[1] https://www.dhm.de/lemo/kapitel/weimarer-republik/wissenschaft/deutsche-atlantische-expedition
English:
The aim of our expedition with the METEOR III is to gain a better understanding of freshwater flux processes over the ocean and thus contribute to a better understanding of the global water cycle. Interestingly, there are some parallels with the German Atlantic expedition, which happened on the Meteor I, even though the objectives of the two expeditions differ. The METEOR I set sail from Wilhelmshaven on April 16, 1925, and returned there on June 2, 1927. Not only do both ships have the same name, but the two expeditions are also exactly 100 years apart. In addition, some of our expedition participants work at the ICBM in Wilhelmshaven. However, the most significant parallel lies in the measurements: During our expedition, the focus is on measuring the temperature and salinity of the Atlantic Ocean to draw conclusions about evaporation processes. One hundred years ago, scientists also took measurements of temperature and salinity to understand the circulation of the Atlantic (Figure 1). In particular, the question of whether there was water exchange between the South Atlantic and the North Atlantic across the equator preoccupied the scientists on board the Meteor I. Meteorological data was also collected for this purpose – as it is on our expedition.
The goals and significance of the two expeditions were different: The expedition from 1925 to 1927 is considered a milestone in oceanography and the birth of physical oceanography. Since then, it has accompanied theoretical oceanography. A lot has changed in 100 years (perhaps too much?), including in oceanography. Today, we have highly accurate sensors for measuring temperature and salinity, which allow us to take continuous measurements at depths of up to several thousand meters. Depending on the depth, these depth profiles usually take two to three hours to complete. While the METEOR III is underway, water is also continuously pumped through a so-called thermosalinograph to record data near the surface. A hundred years ago, temperature and salinity at different depths were measured in a completely different way to create maps of their distribution (Figure 2). For this, a tipping thermometer was attached to a wire, along with a water sampler, and lowered to a specific depth. Then, a drop weight was sent down the wire to trigger the mechanism for closing the water sampler and tilting the thermometer at that depth. The tilting separated a certain amount of mercury in a capillary, and this amount was used to determine the temperature on board.
The salinity was determined from the sample taken by the water sampler. For this purpose, a certain amount of the sample was titrated with silver ions to determine the total concentration of chloride (Cl⁻), bromide (Br⁻), and iodide (I⁻) ions. Since the percentage composition of salt ions in seawater is constant, it was possible to calculate the total concentration of all salt ions. This was expressed as salinity in grams per kilogram of seawater or per mille. However, this method was very time-consuming.
Although the measurement methods and objectives of the expeditions differ, some parallels cannot be denied. It took two years to create the maps showing the distribution of temperature and salinity throughout the Atlantic. However, without this data, the circulation of the Atlantic would have remained unknown, as would its role in the climate system. The M211 expedition is underway to contribute to this as well.